¶ Overview
The Defend-O-Tron comes with Crowdsec and Traefik dashboards pre-installed. Utilizing Grafana you can view and customize the local dashboards to your needs.
Some of the dashboards are only accessible via DNS fully qualified domain names (FQDN), and require you to configure your LAN or workstaion with the local Defend-O-Tron DNS to view them. The majority of overviews are directly available on the management interface without the DNS requirements
The dashboards can be accessed via browsing to https://dashboard.protected.lan/grafana. The default username and password to access Grafana are admin/admin. You will be asked to change the admin password upon login, although there is an option to skip the change if you so desire.
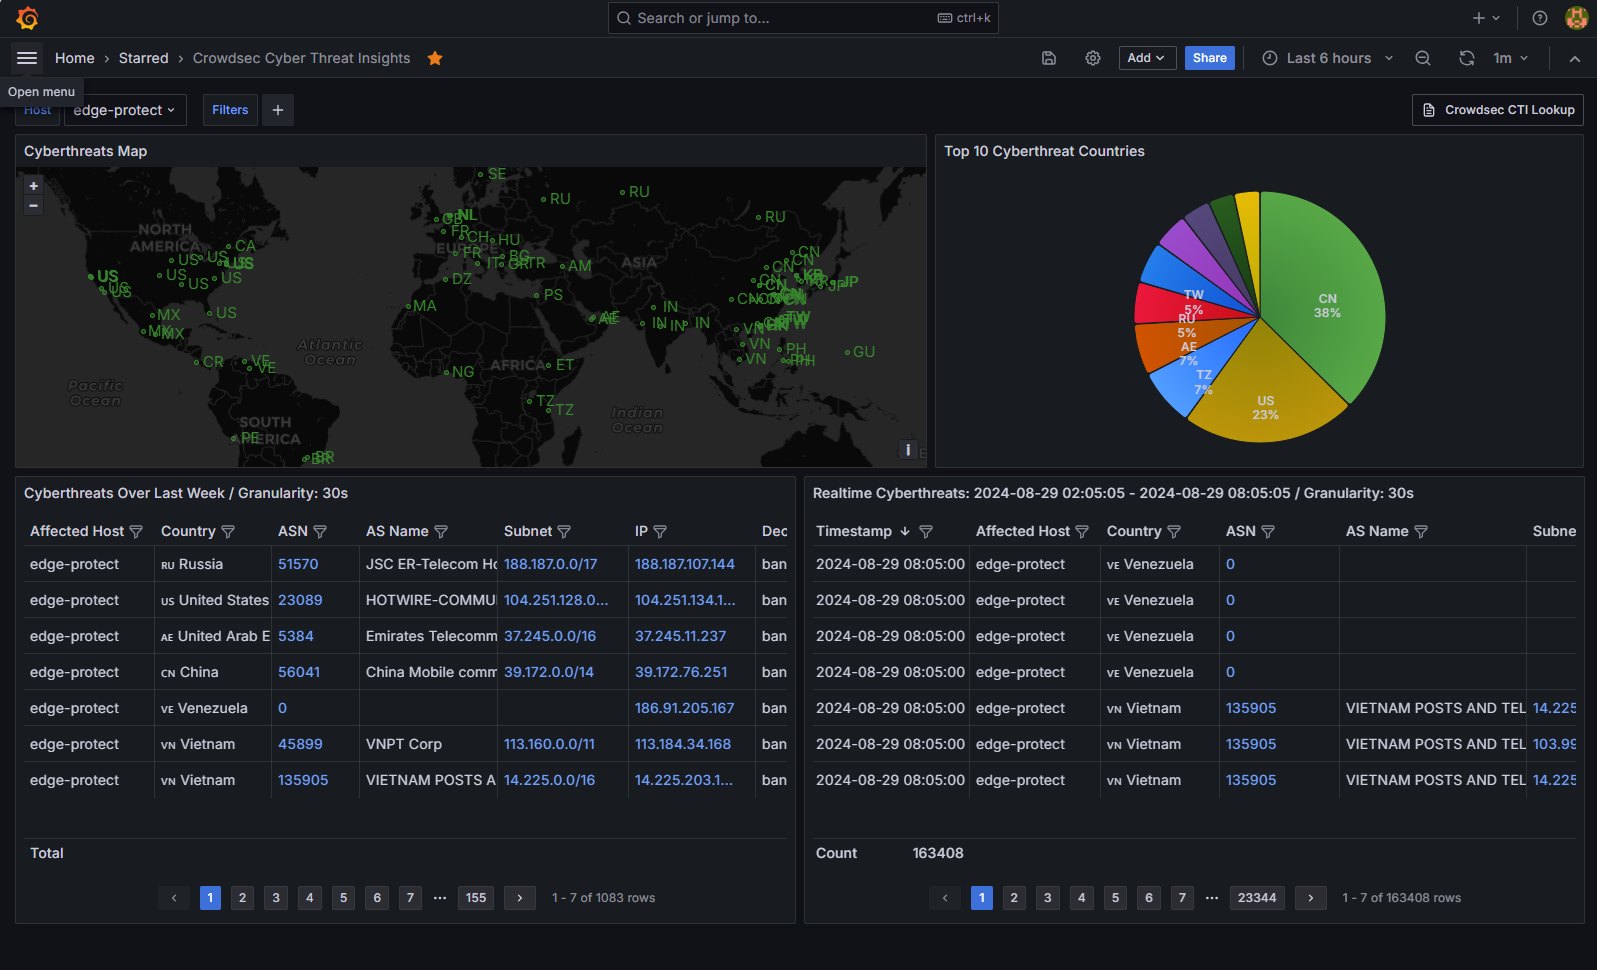
¶ Cyberthreats Overview
This provides a global view of cyber-threats occurring in realtime. From here you can access the Crowdsec CTI, Shodan, Censys, and Criminal IP lookups by clicking the offending address.
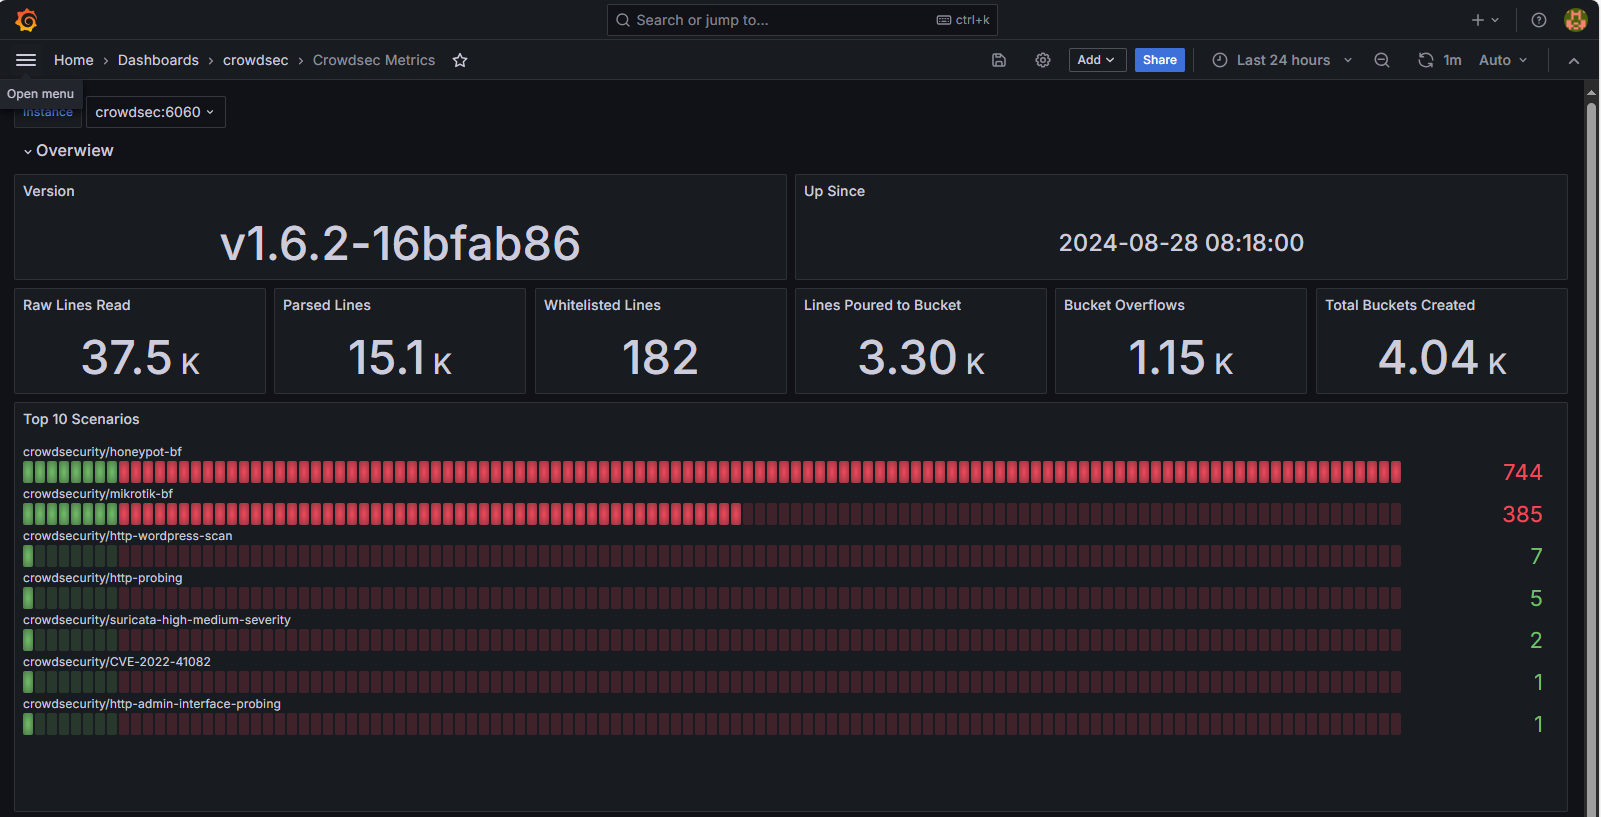
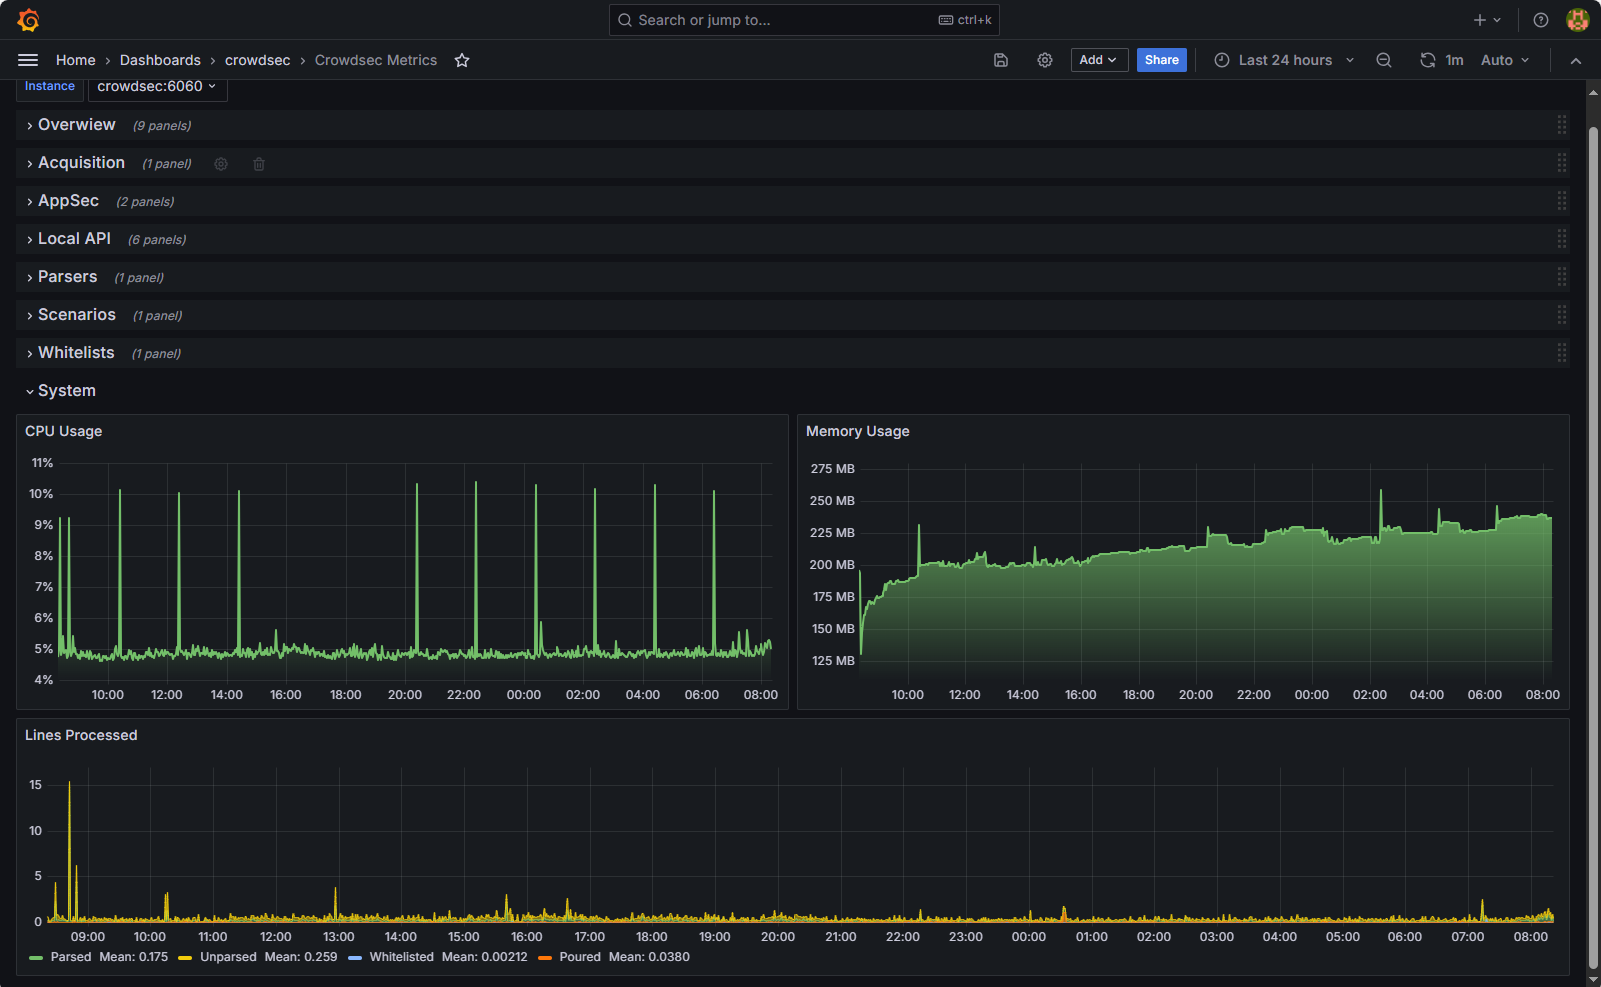
¶ Crowdsec Metrics
This provides an overview of the parsed logs and scenario decisions from the Crowdsec engine. The equivalent terminal command is
admin@defend-o-tron ~$ cscli
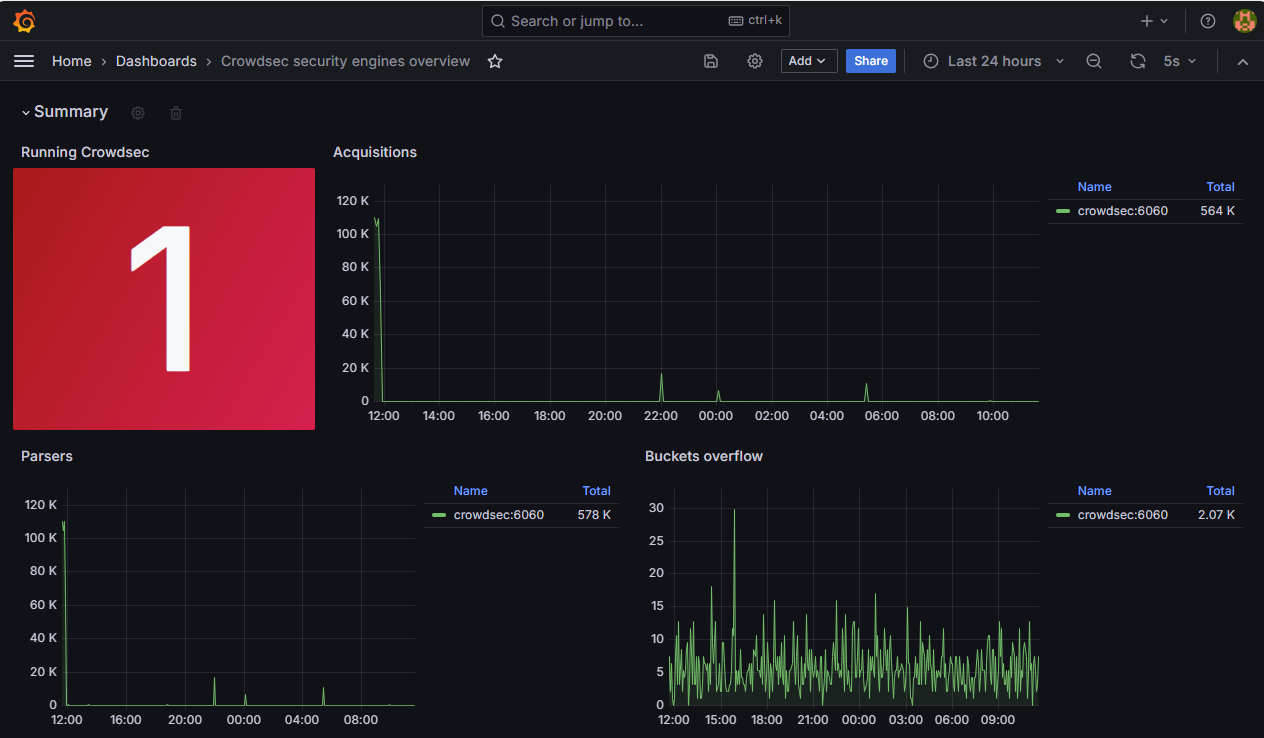
¶ Crowdsec Engine Overview
¶ Summary
¶ System Usage
¶ Audit Evidence
The Audit Evidence dashboard summarizes what the audit subsystem has captured for compliance — continuity proof at the top, integrity row (manifest signatures, file SHA-256 matches, RFC 3161 trusted-timestamp coverage), KPIs for the period, trend graphs, and per-incident tables for events, active decisions, DNS anomalies, suspicious TLS handshakes, and file transfers with SHA256 hashes. A framework-control mapping at the bottom shows which device feature satisfies which outcome under NIST CSF 2.0, ISO/IEC 27002:2022, NIS2 Article 21, and NIST SP 800-61 Rev 3.

This dashboard is the live view. To export a signed evidence ZIP for an auditor covering any past period, see Compliance Reporting.
Renamed in awesome-o-services 1.1.4 (previously titled "NIS2 Evidence Pack" at
/grafana/d/nis2-evidence-pack/). The new URL is permanent; the old URL will 404.
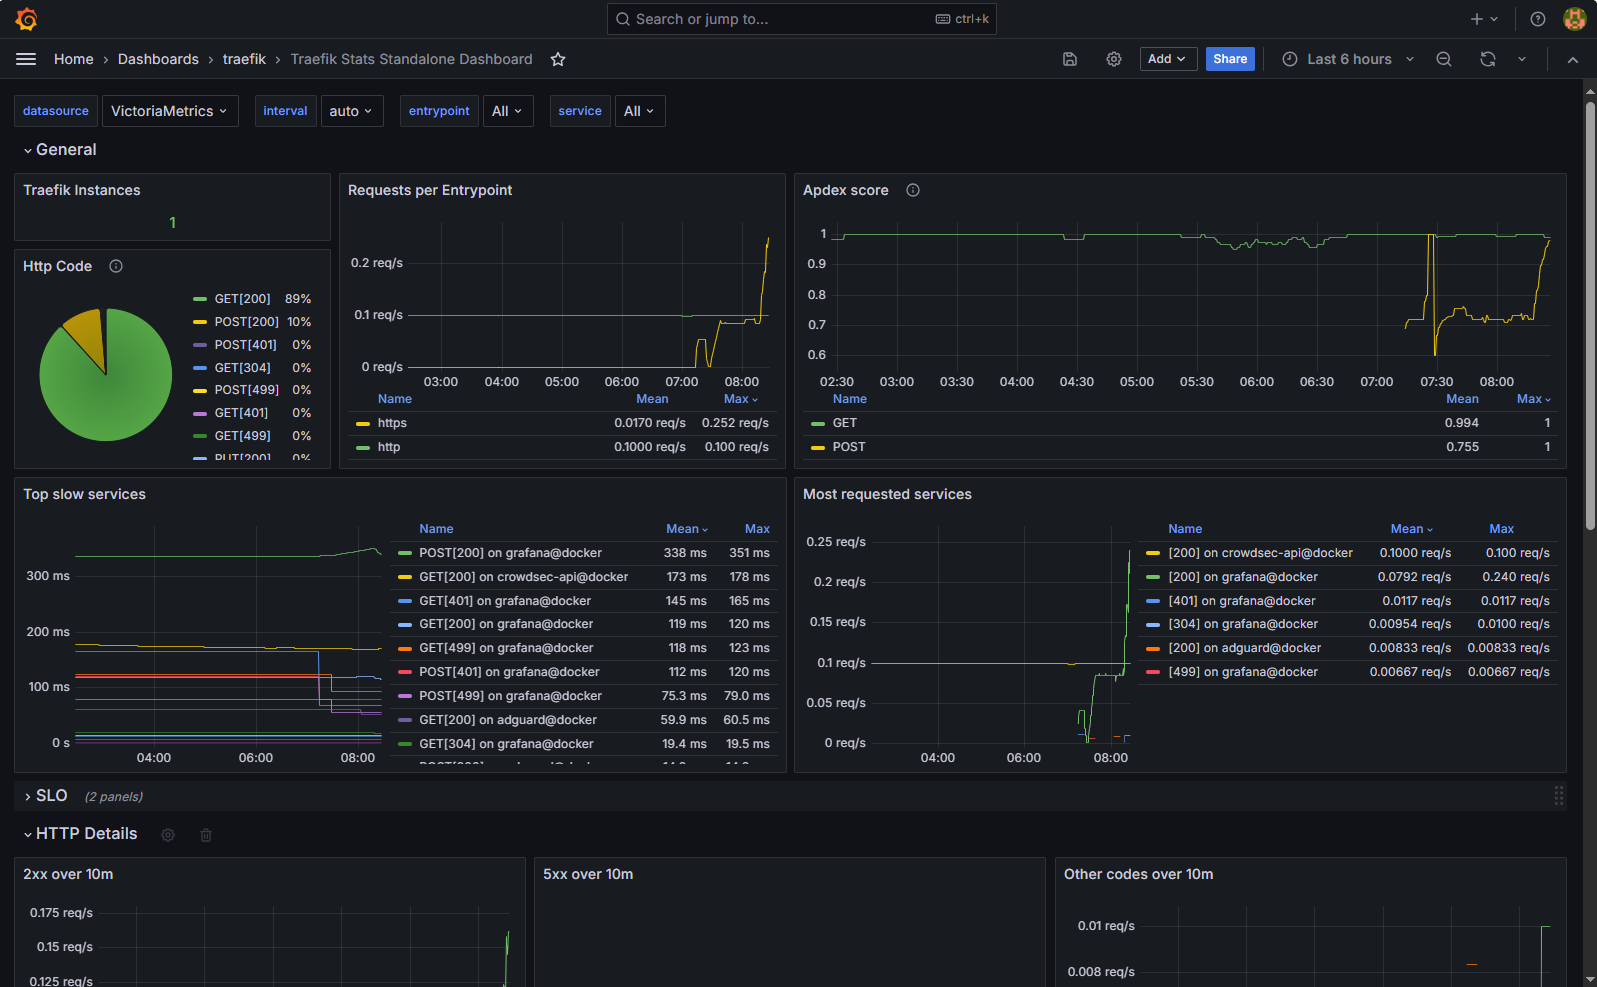
¶ Traefik
Powering the reverse proxy service is Traefik. It's pre-configured with the Defend-O-Tron SSL/TLS certificate, you can install the root CA certificate for added security, intstructions are here
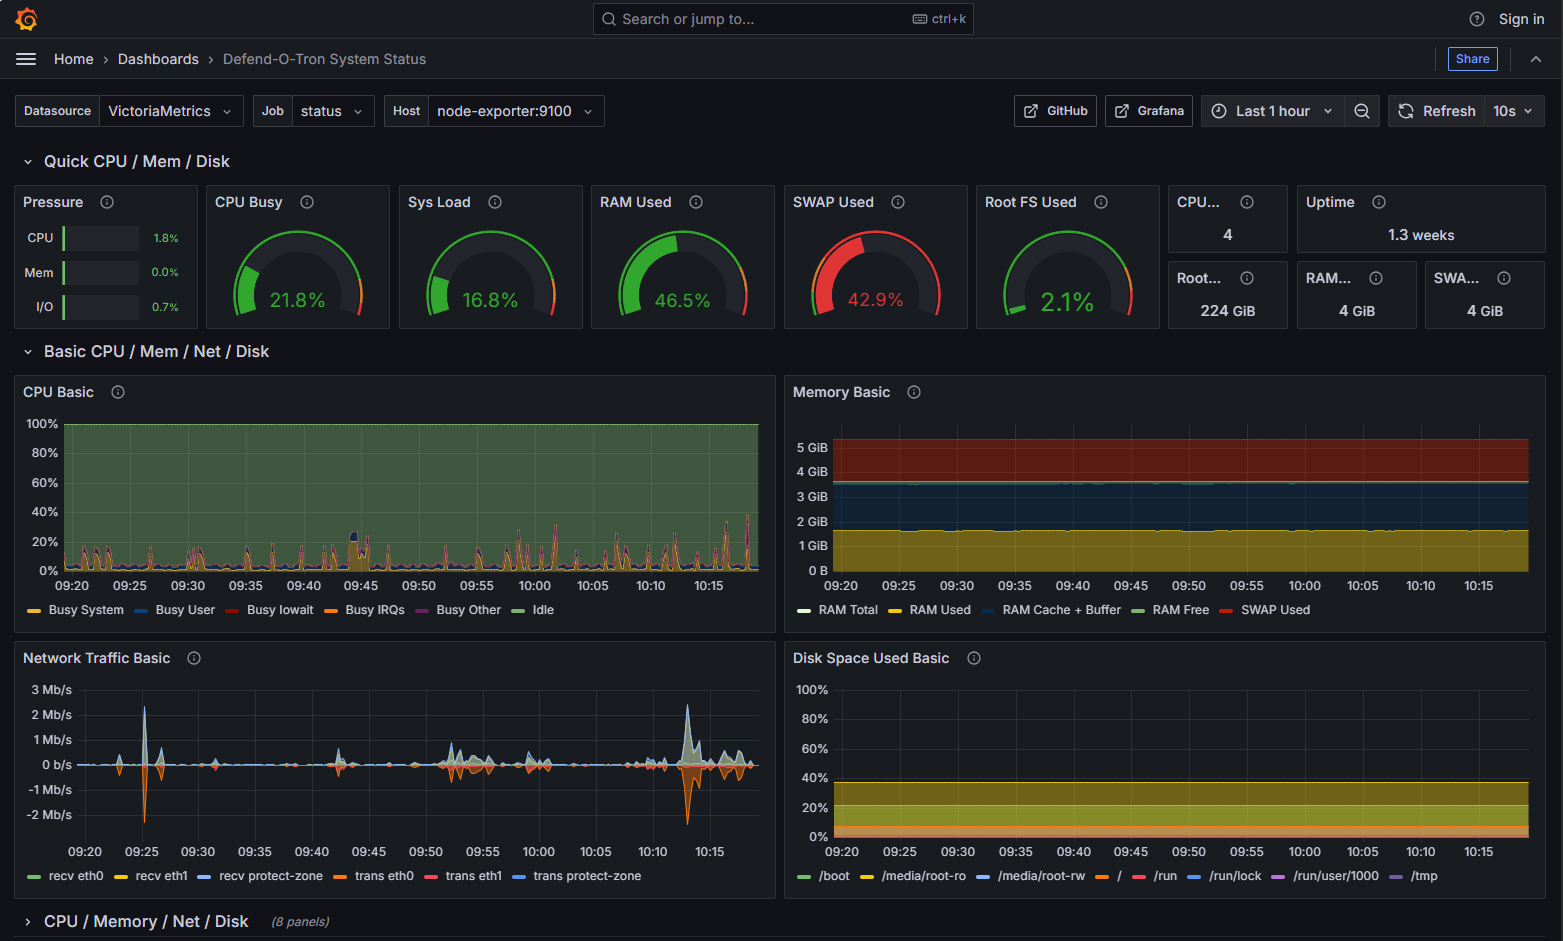
¶ Enhanced System Overview
You can get a more detailed view of the Defend-O-Tron system status here — CPU, memory, disk, network, and per-service health metrics over time.
Defend-O-Tron System Status Dashboard